How to Get Started With Marketing Analytics: A 5-Step Framework

Nowadays, marketing has become a really tough job. No matter how much effort you put in your campaign, you'll always feel something could be improved. Not only this, but also there is the jumping tendency from one thing to another.
With all the confusions in mind, you need to understand if your marketing efforts are not being wasted. That's why, you need to do a little bit more with marketing analytics.
We have discovered a five-step framework for marketing analysis. The main thing about marketing analysis is to plan and build systems that deliver key insights in order to effectively forecast and optimize your company's marketing efforts.
Read the full article to find out.
However, if you need marketing, business coaching, and tech support, do check out our BBR Network Packages page.
See you on the action-field,
Raksha Sukhia, SMB Growth Expert,
Founder BBR Network. #bbrnetwork
Want to better understand if your marketing is working? Need to do more with marketing analytics?
In this article, you’ll discover a five-step framework for marketing analysis. You’ll also learn how to plan and build systems that deliver key insights so you can effectively forecast and optimize your marketing efforts.
#1: Set Up a Framework for Tracking the Right Data in Marketing Analytics
Perhaps you’ve been plagued by this in your own business: You know a ton of numbers but you’re not able to use them. This happens all too often in the world of measurement because there’s no framework for those numbers.
So how do you know if your marketing is working?
To better analyze your data, I have a simple five-step framework that you can use immediately to start getting stuff done. Read the article below for an easy-to-follow walkthrough of this framework or watch this video:
Planning
The first step in this framework is planning. You might be thinking, “Of course we do planning,” but you probably don’t do it in this particular way. With this method of planning, you need to know:
It’s something I call the QIA model: question, information, and action from the answers you get.
The most important part of this method is the action. If you can’t tie the answers you’re getting to a marketing action, you might be collecting a vanity metric. But if you can tie it down to a marketing action, you know it’s something useful.
In the planning stage, you start to sketch out what a report might look like using the back of a napkin, a Post-it note, or a whiteboard. You want to determine how you’ll be able to see these answers coming through.
Building
The second step of this framework is the build. This is where you’ll use tools like Google Analytics to collect and store the information you’ll need to answer the questions you came up with in the planning stage.
Another tool you might consider using is Google Tag Manager. It will help you get more insight into the different behaviors happening on your site. Essentially, it gives you a chance to answer better questions because you get more specific answers.
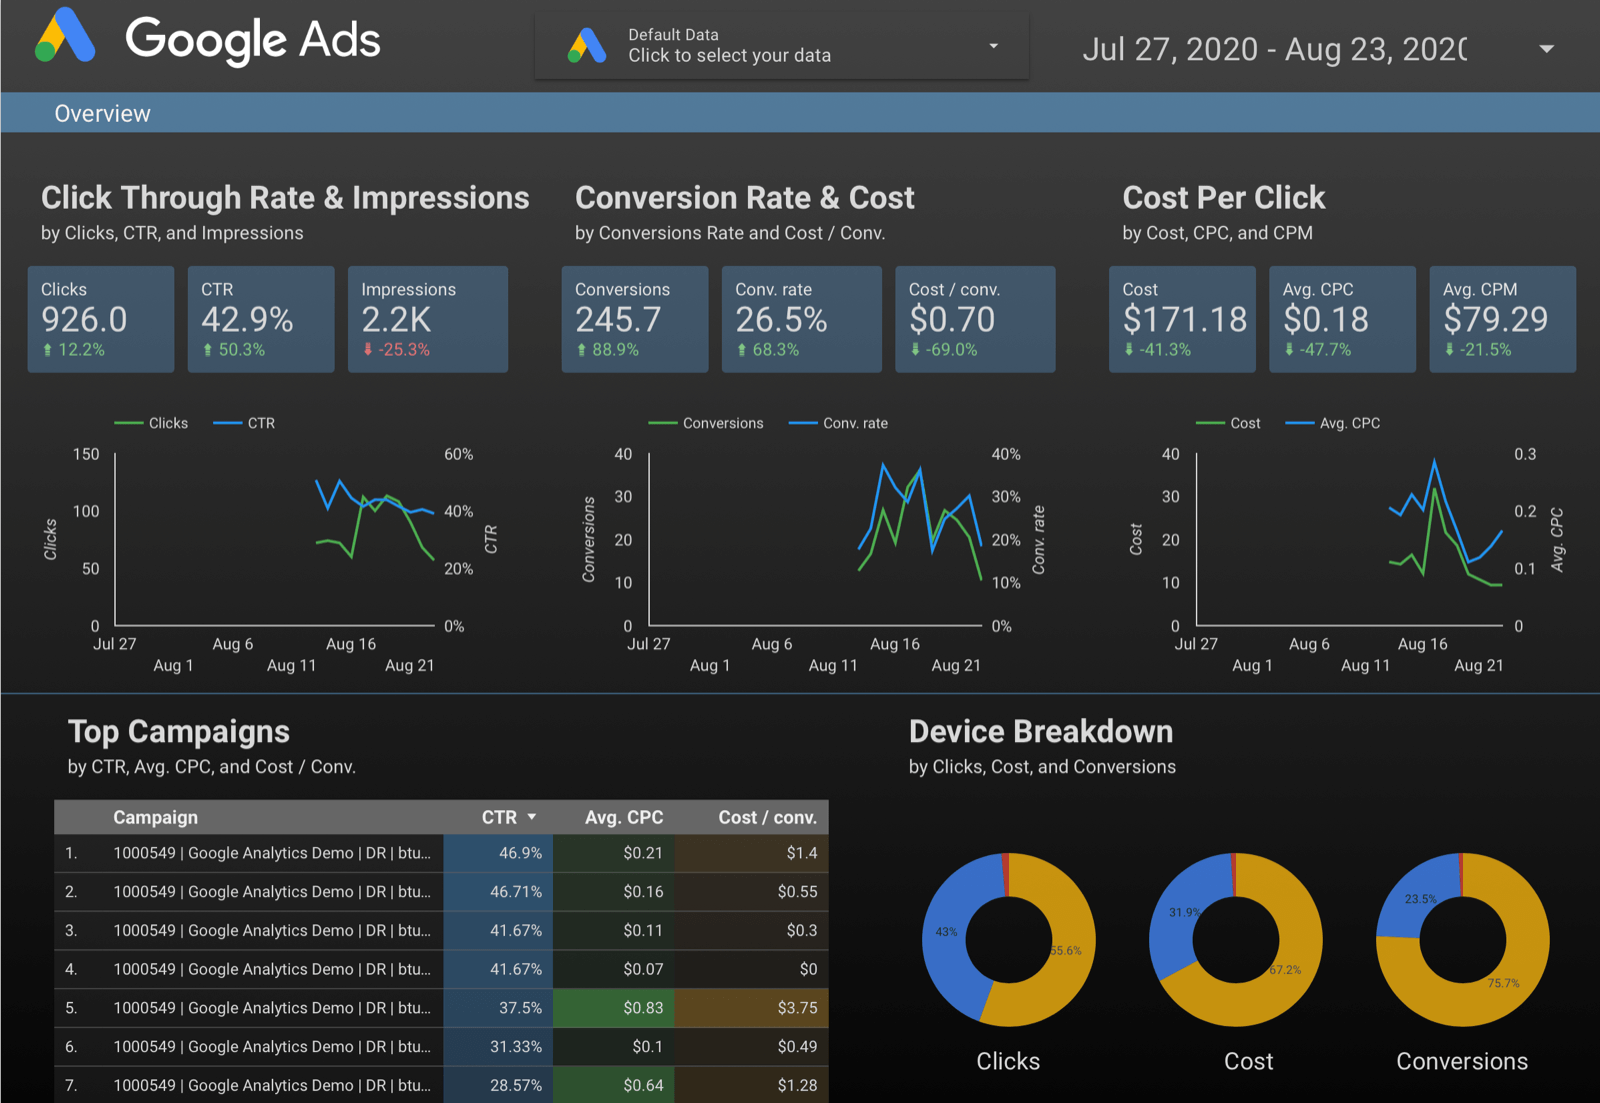
Reporting
The third step of the framework is reporting. This is where you use the Google Analytics reports. Maybe you’ve already tried to do that. They’re actually pretty useful but they contain a lot of information that you probably don’t need. That’s because they’re trying to answer a lot of different questions all at once.
In reality, there’s another platform you should take a look at: Google Data Studio. It has one purpose: to help you create dashboards that answer your questions and only your questions. These dashboards don’t have a lot of extra information you don’t care about. They just give you the answers you need.
At this point, you can start to see how the first three steps work together. In the planning stage, you’re thinking about your questions; in the building stage, you’re collecting information to get those answers; and in the reporting stage, you’re displaying those answers so you can take the actions you said you were going to take.
Forecasting
The fourth step is forecasting, which is often skipped. Instead of saying things like, “We’ll have 1,000 clicks coming to the page” or “We’re going to make $10,000 next week,” you start to say how that’s going to happen.
So you’ll have $10,000 in revenue because you’re going to get 100,000 impressions from Facebook. Of those 100,000 impressions on Facebook, 1% will click through, 30% will opt in, and 50% will buy through an email for an average cart value that will add up to $10,000.
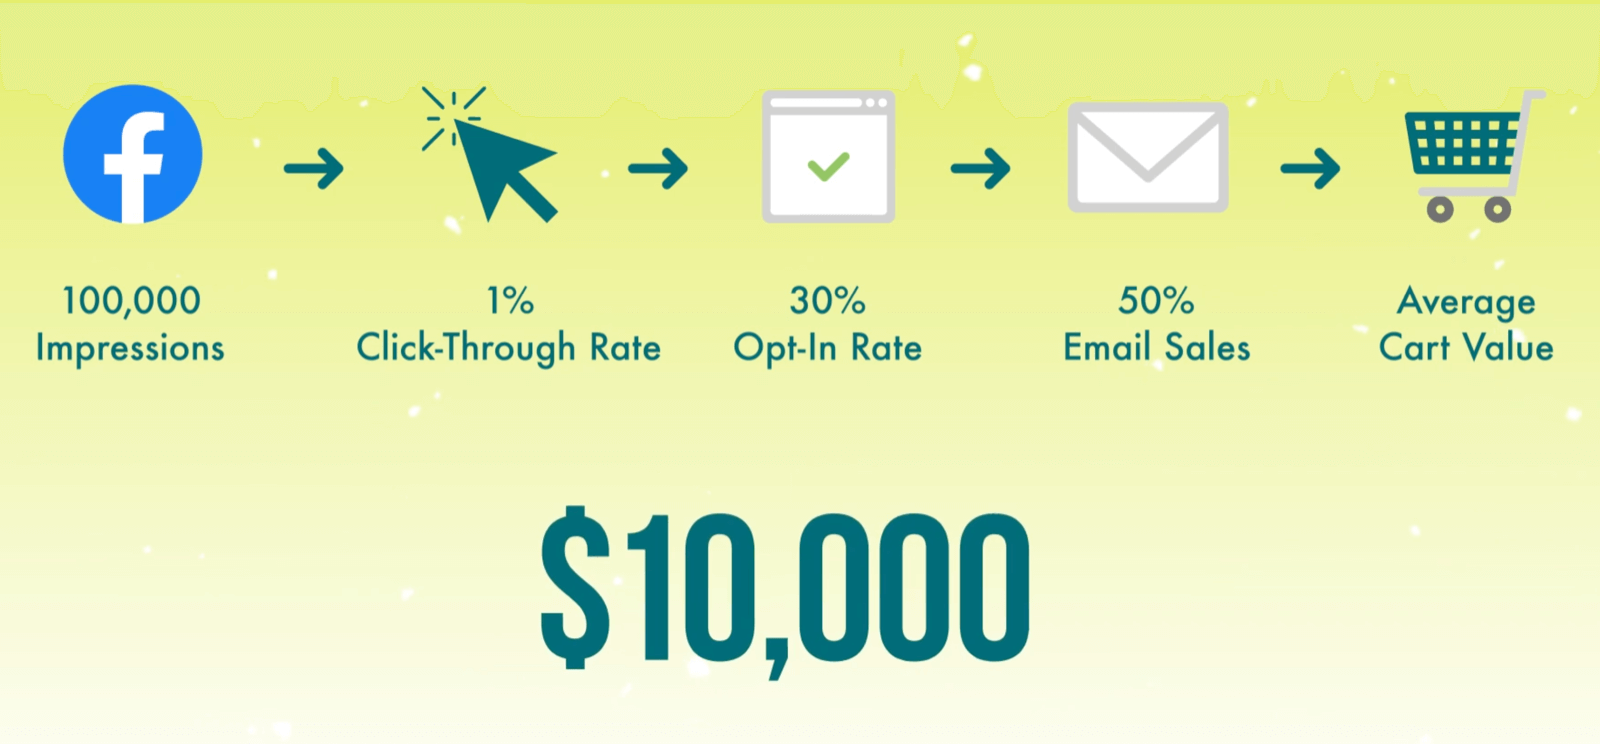
You’re forecasting not only what your results will be but also how you’re going to get there. So when you set up your measurement, you’re asking the question, “Did it work like it was supposed to?”
Implementation and Optimization
The fifth step is using what you’ve set up. You’re measuring against those results so you can instantly see what works and what doesn’t—what’s performing as expected and what isn’t.
In the optimization step, you look at your numbers and say, “Okay, the cart abandonment rate is way too high. It’s spiking up with this new traffic source. Let’s go talk to the marketing department and fix this.”
You know exactly where the issue is. Maybe it’s the fact that the average cart value was lower than you thought it was going to be. Or perhaps it was higher than you expected. Now you can figure out why and then duplicate or scale up things that are working and fix things that aren’t. Either way, you’ll know where to focus your resources, which is the most important thing in the optimization step.
Marketers tend to race toward the optimization step. They try to get into Google Analytics so they can figure out what’s working and what’s not so they can take action. But in reality, they skipped planning so they haven’t thought about the questions they’re trying to answer. They skipped building so they weren’t properly using the tools and setting up Google Analytics and Tag Manager. They don’t actually even have the information to get any answers.
They didn’t think about the different actions they were going to take based on those answers. There really was no reporting to do. They certainly aren’t forecasting. They’re just trying to optimize.
Once you have a solid framework in place for your marketing analysis, you can apply UTM parameters to the URLs that will help you understand where your most valuable traffic is coming from.
#2: Create UTMs Using the Google Campaign URL Builder
Marketers use UTMs (urchin tracking modules) to help them figure out where their traffic is coming from. UTMs are tiny bits of parameters that are added to the end of URLs. It’s anything that says “utm_,” whether it’s source, medium, campaign, or a couple of others.
By adding these parameters to the links you share, you can get detailed information in Google Analytics about how people find you and come to your site.
To learn how to add UTM parameters to your website links, read the text below for an easy-to-follow walkthrough or watch this video:
Before we get into how to create UTMs, let’s dive into Google Analytics to see how it handles traffic and what UTMs look like.
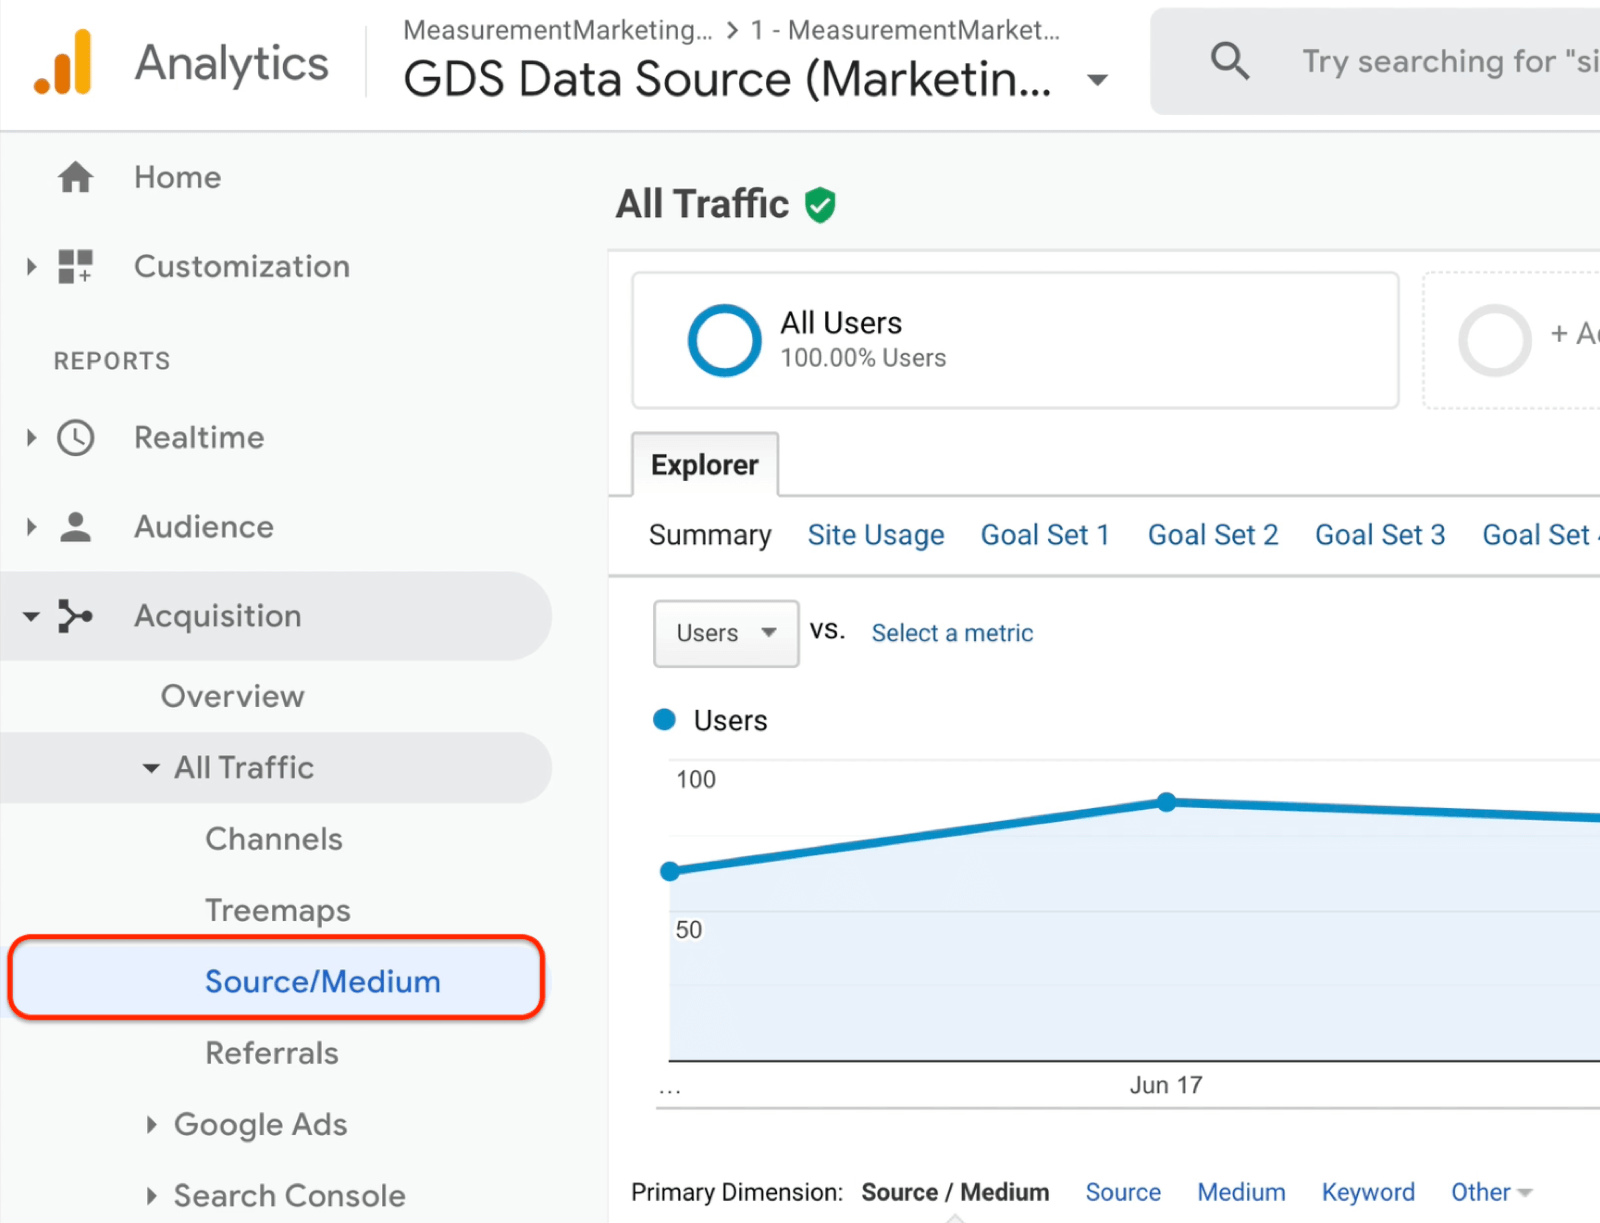
The first report we’ll look at is the source/medium report. To view this report, open Google Analytics and in the left navigation, select Acquisition > All Traffic > Source/Medium.
The first report we’ll look at is the source/medium report. To view this report, open Google Analytics and in the left navigation, select Acquisition > All Traffic > Source/Medium.
When Google Analytics is trying to figure out where traffic is coming from, it primarily cares about three things:
- Source: The brand name of the traffic source
- Medium: The type of traffic coming from that source
- Campaign: The purpose of the traffic
Google Analytics does its best to let you know where traffic is coming from by identifying three types of traffic on its own: organic, referral, and none.
Organic traffic comes from a search engine. If you see “google / organic” or “bing / organic,” as shown below, you know people are finding you from searches via Google and Bing.
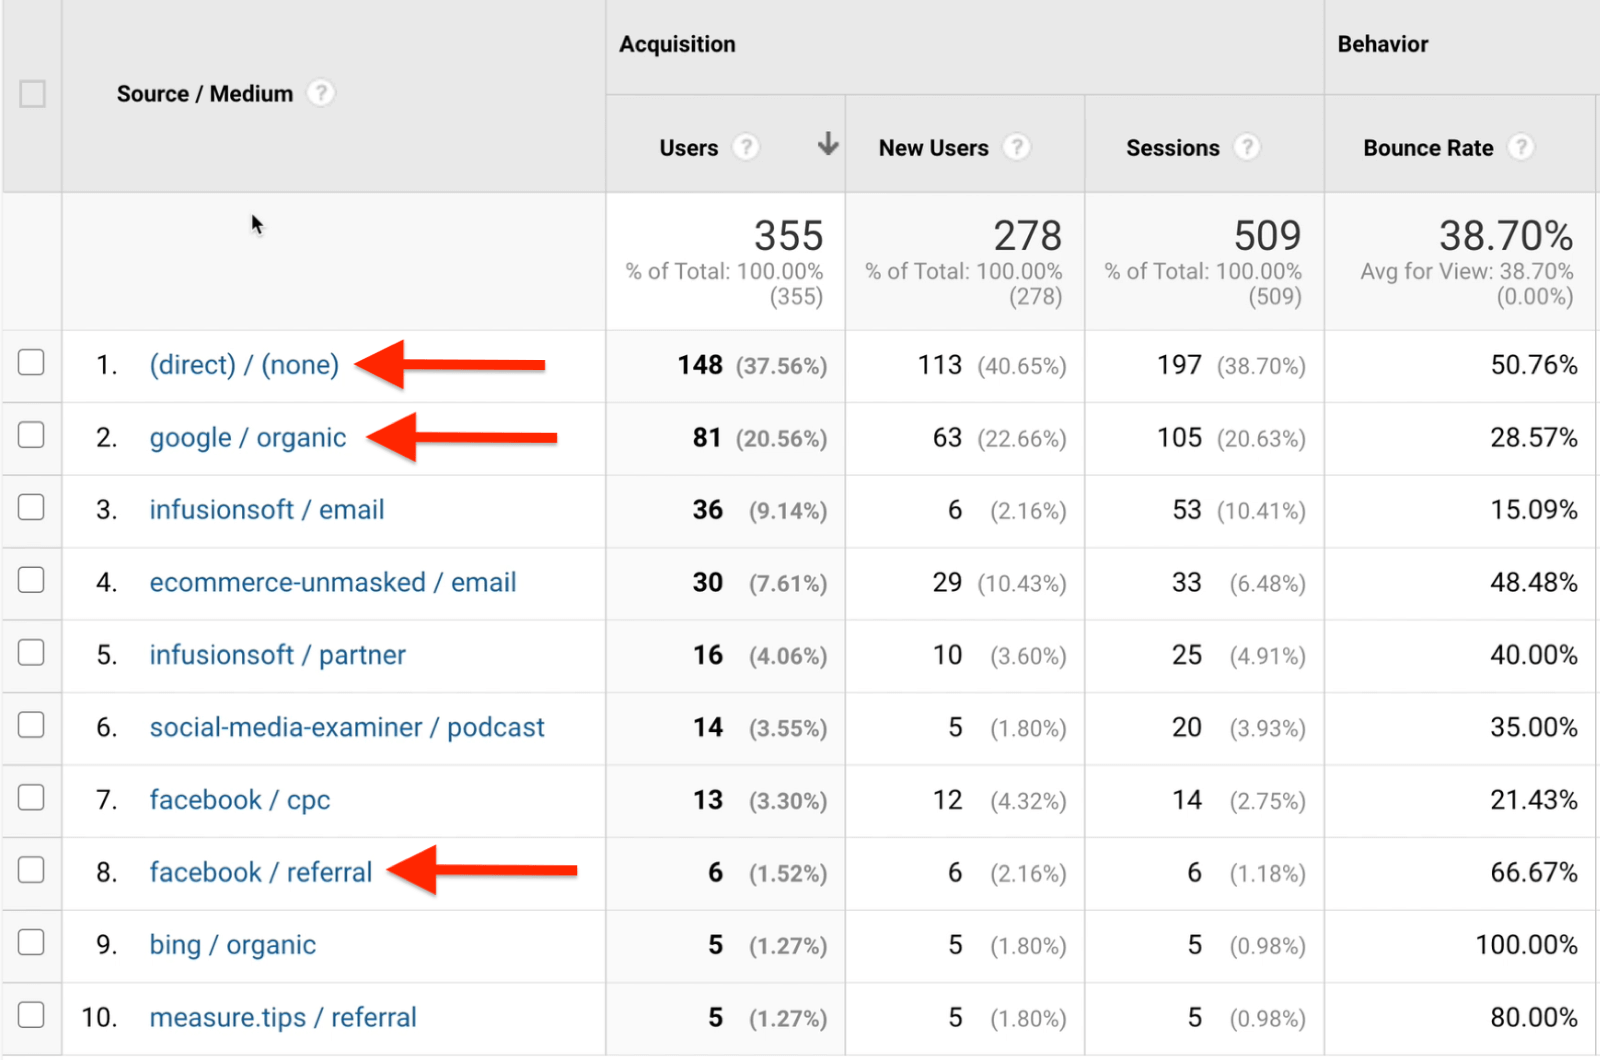
Referral traffic came from another website such as Facebook (“facebook / referral”) or YouTube (“youtube / referral”).
None signifies that Google isn’t sure how that traffic got there; it just showed up. You always see this shown as “(direct) / (none)” on this report. It might mean people are coming directly to your site, which is what happens most of the time in our case.
None signifies that Google isn’t sure how that traffic got there; it just showed up. You always see this shown as “(direct) / (none)” on this report. It might mean people are coming directly to your site, which is what happens most of the time in our case.
In the report above, you’ll also notice “email,” “partner,” “podcast,” and “cpc” listed as types of traffic. You probably won’t see these yet in your Google Analytics because you haven’t used UTMs to identify those types of traffic.
Now that you have an understanding of the source/medium report, I want to look at a report that’s specifically built to show you how your traffic is working together. To open this report, go to Acquisition > Campaigns > All Campaigns.
Now that you have an understanding of the source/medium report, I want to look at a report that’s specifically built to show you how your traffic is working together. To open this report, go to Acquisition > Campaigns > All Campaigns.
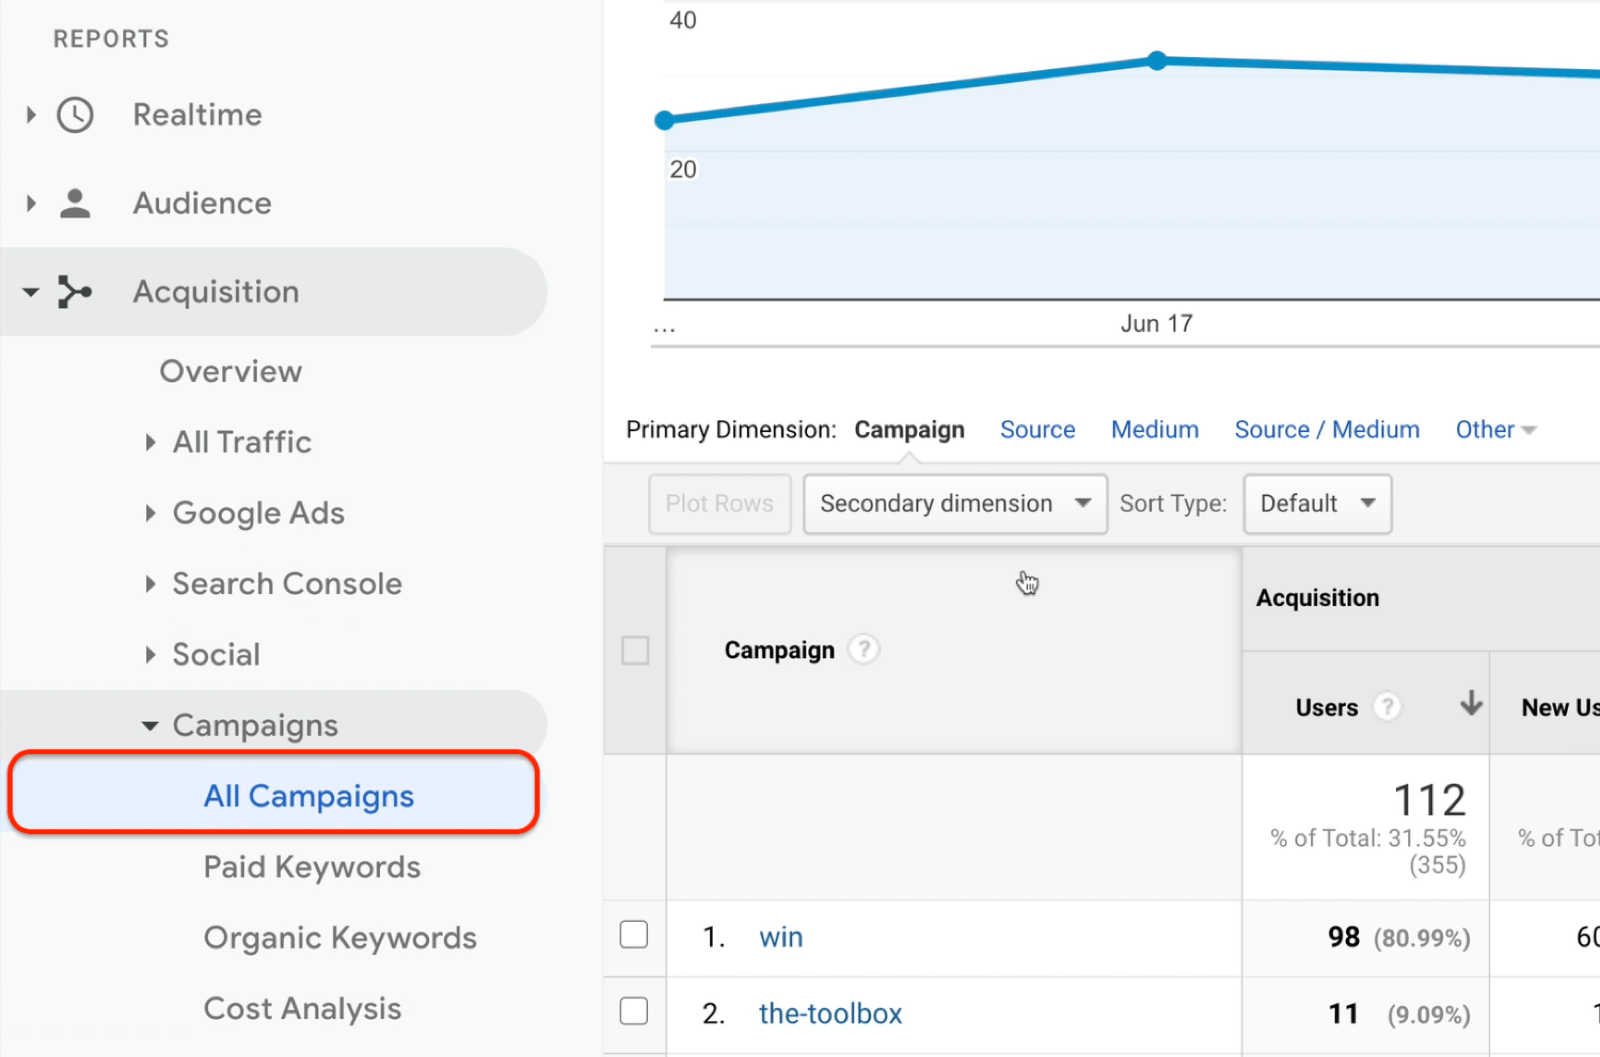
When you open your campaign report, it won’t look like the one in this example. If you haven’t used UTMs yet, you won’t see anything. If you see a lot of stuff on this report, it means your campaign naming conventions have been a little fractured. I’m going to give you some tips on how you can fix this going forward as well.
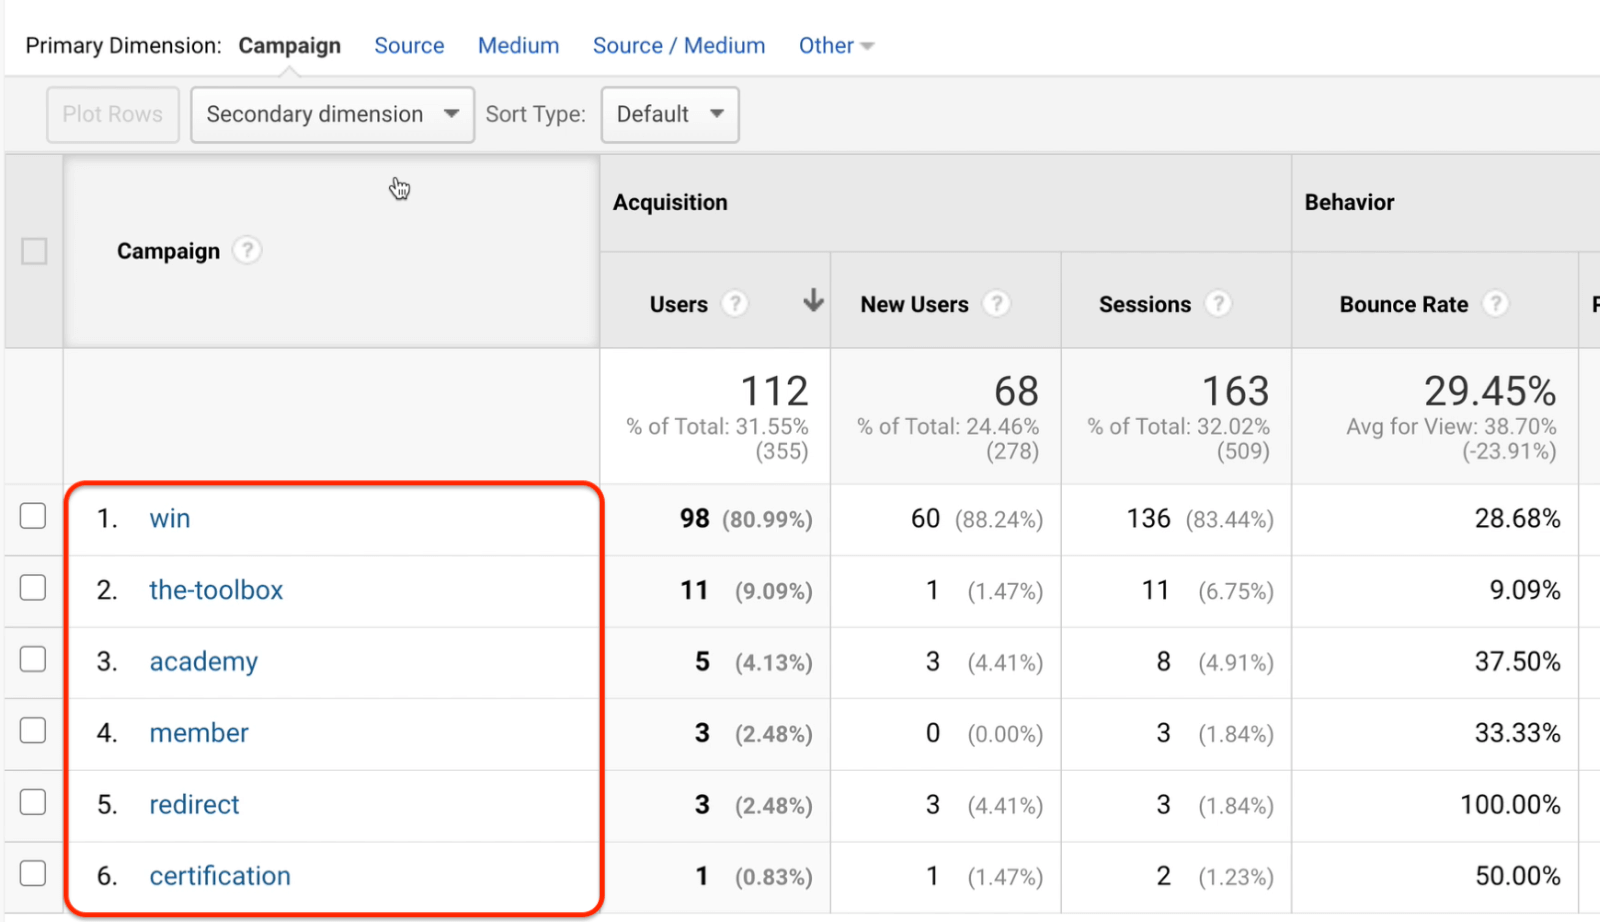
The image below shows campaigns for my business. At the top is one of our primary campaigns, which is called WIN. As a company, we’ve decided that everything is the WIN campaign so we’ve told Google Analytics that WIN is the purpose of this traffic.
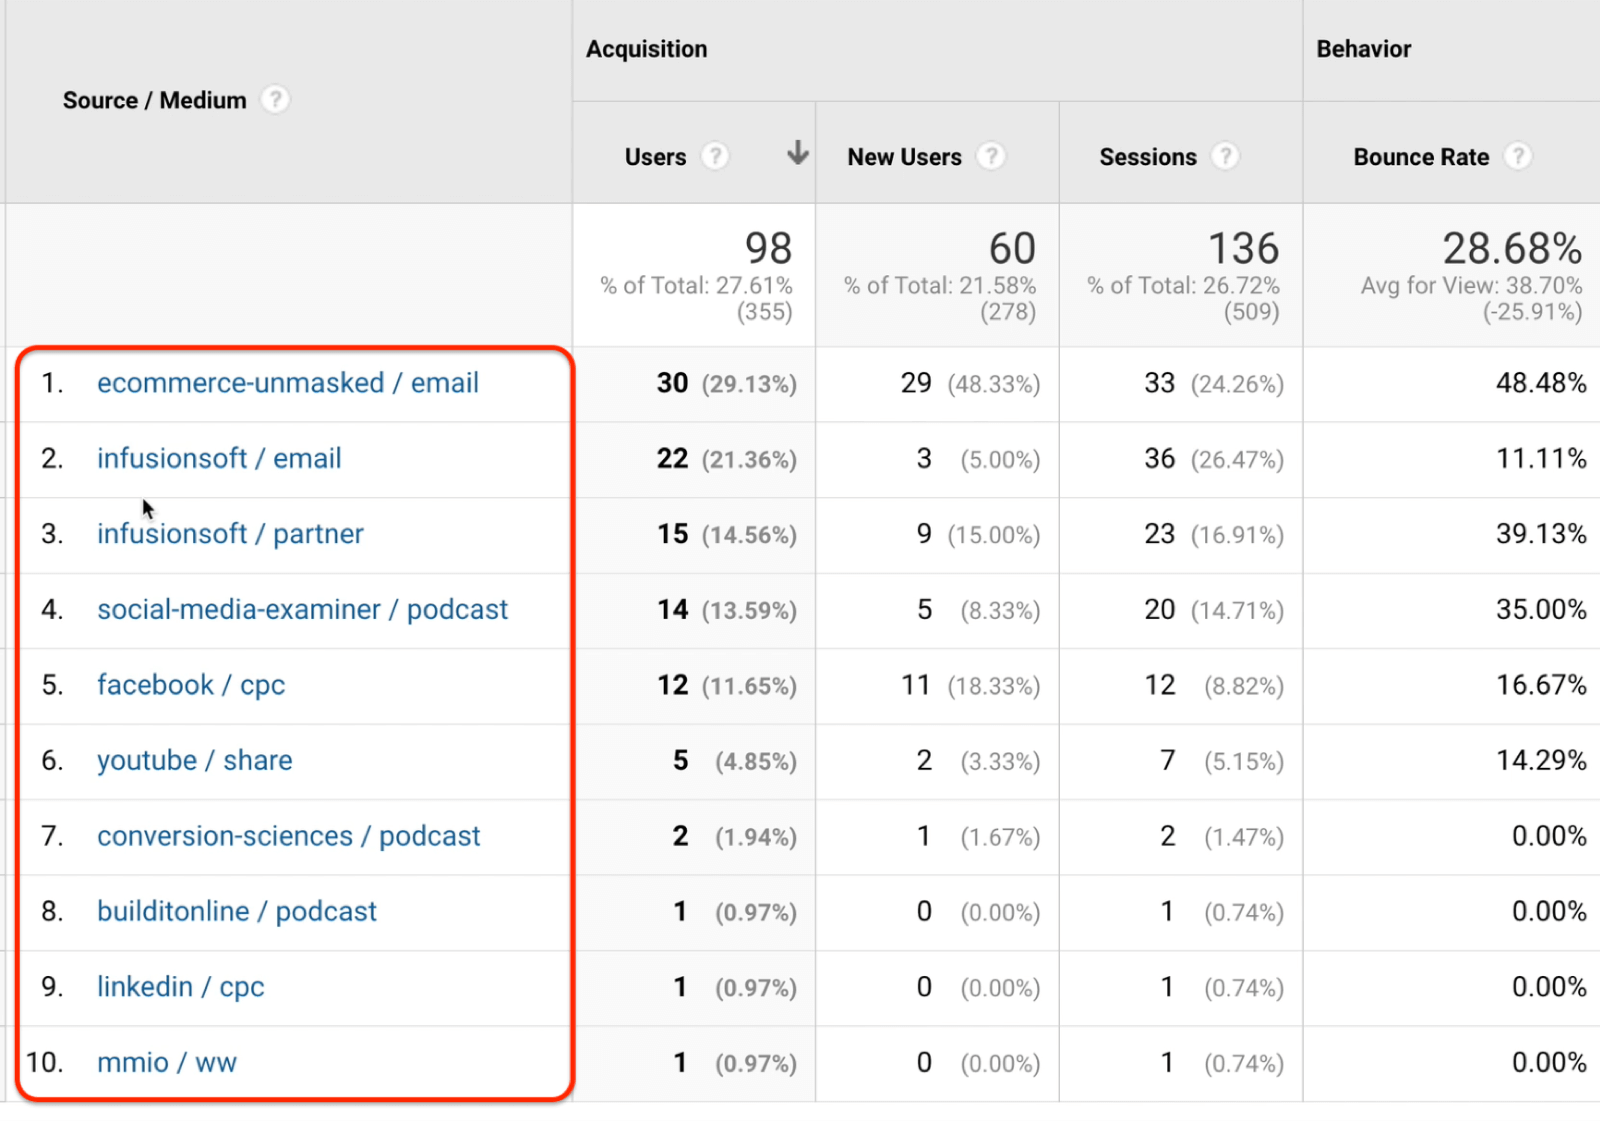
If you click into WIN, you can see every source and medium for the WIN campaign—all of our UTMs. You see emails from Infusionsoft (which is our system) and affiliate traffic, where our partners are using Infusionsoft to send traffic to us. You also see Facebook and LinkedIn paid traffic.
Next to YouTube, you see “share” rather than “cpc” because we’re not paying for this traffic. It comes from the links included in our YouTube video descriptions. This allows us to see which videos people are viewing and coming through to our site.
At the bottom of the list, you see “mmio/ww.” This lets us track when people are clicking on links in some of the resources we’ve produced and coming back to our site.
The campaign report tells you a story as a marketer or business owner. In this case, it shows all of the different traffic sources, the types of traffic coming from those sources, and how they’re working together to get somebody to move through the customer journey so they ultimately purchase a WIN course from us. You can do the same thing for your business by using UTMs.
There are a couple of different ways to create UTMs. We’ll start with an easy-to-use free tool from Google called Campaign URL Builder. For this example, suppose you’re running a Facebook ad to drive traffic to your website and you want to know if your ad is working.
To create a UTM to track this, you fill in the relevant details in the form on the Campaign URL Builder page.
Start by telling Google the page that you’re trying to send people to. Enter this URL in the Website URL box.
Next, for Campaign Source, enter the brand name of the traffic source, which is Facebook in this case. For Campaign Medium, describe the type of traffic. We’ll use “CPC” for cost per click.
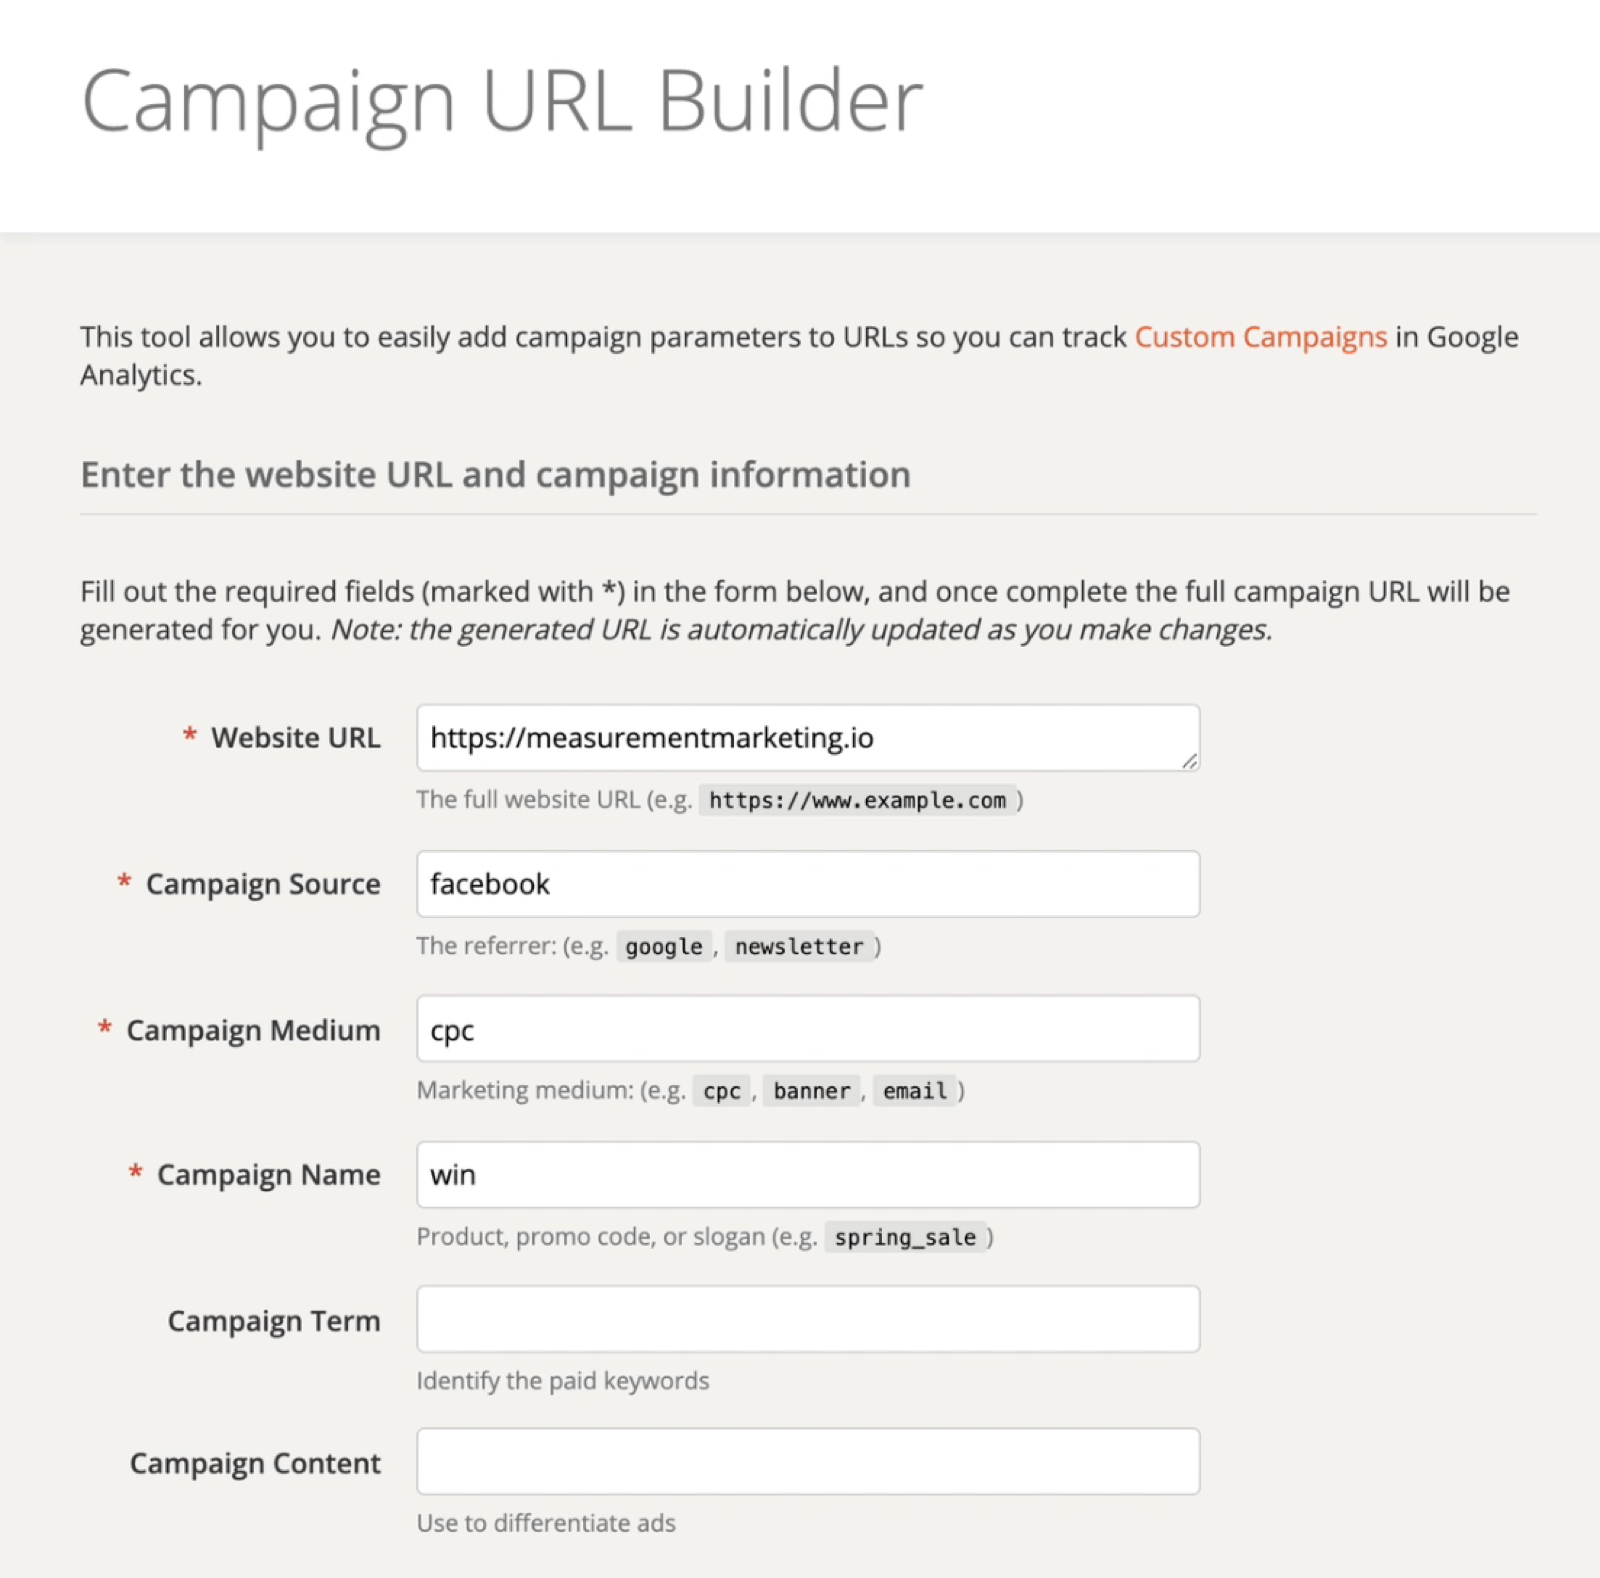
Finally, type in a campaign name. This is where you tell Google the purpose of this traffic (i.e., you want people to purchase your course). The Campaign Term and Campaign Content fields are optional so you can skip those for now.
If you scroll down the page, you’ll see Google has created a link for you based on the information you typed into the form. Click Copy This URL and open up a new tab in the browser to test the URL to make sure it’s working.
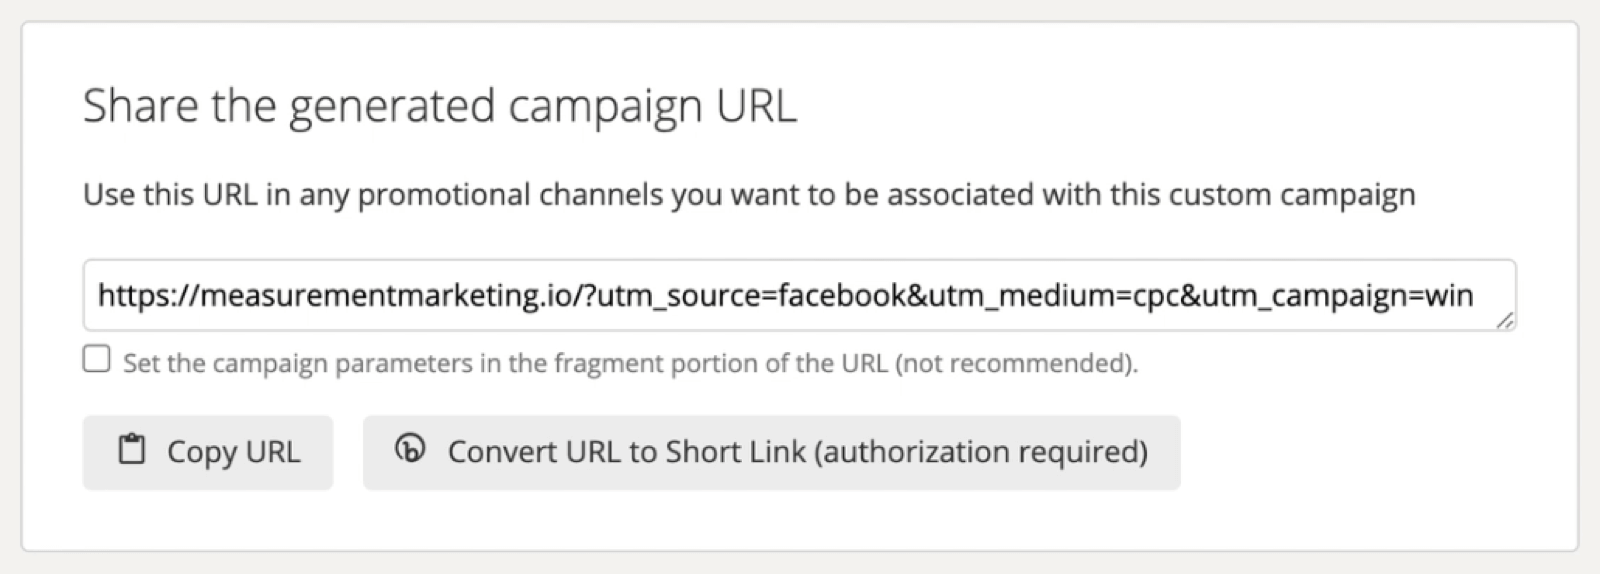
From a user’s perspective, the page that opens will look normal. But Google Analytics will know the source of the traffic, the type of traffic coming from that source, and the purpose of the traffic.
Once the page has loaded, copy the UTM parameters in the URL and give it to Facebook with your ad. Facebook will do the rest of the work for you.

If you’re setting this up for email or other types of platforms, sometimes you’ll just copy and paste the entire link with UTMs. Other types of email services may have a space for UTMs. It can vary by platform. But most platforms know what UTMs are and expect you to use them.
#3: Confirm That Your UTMs Show Up in Google Analytics
Once you’ve created a UTM, you also want to make sure it shows up in Google Analytics the way you want it to.
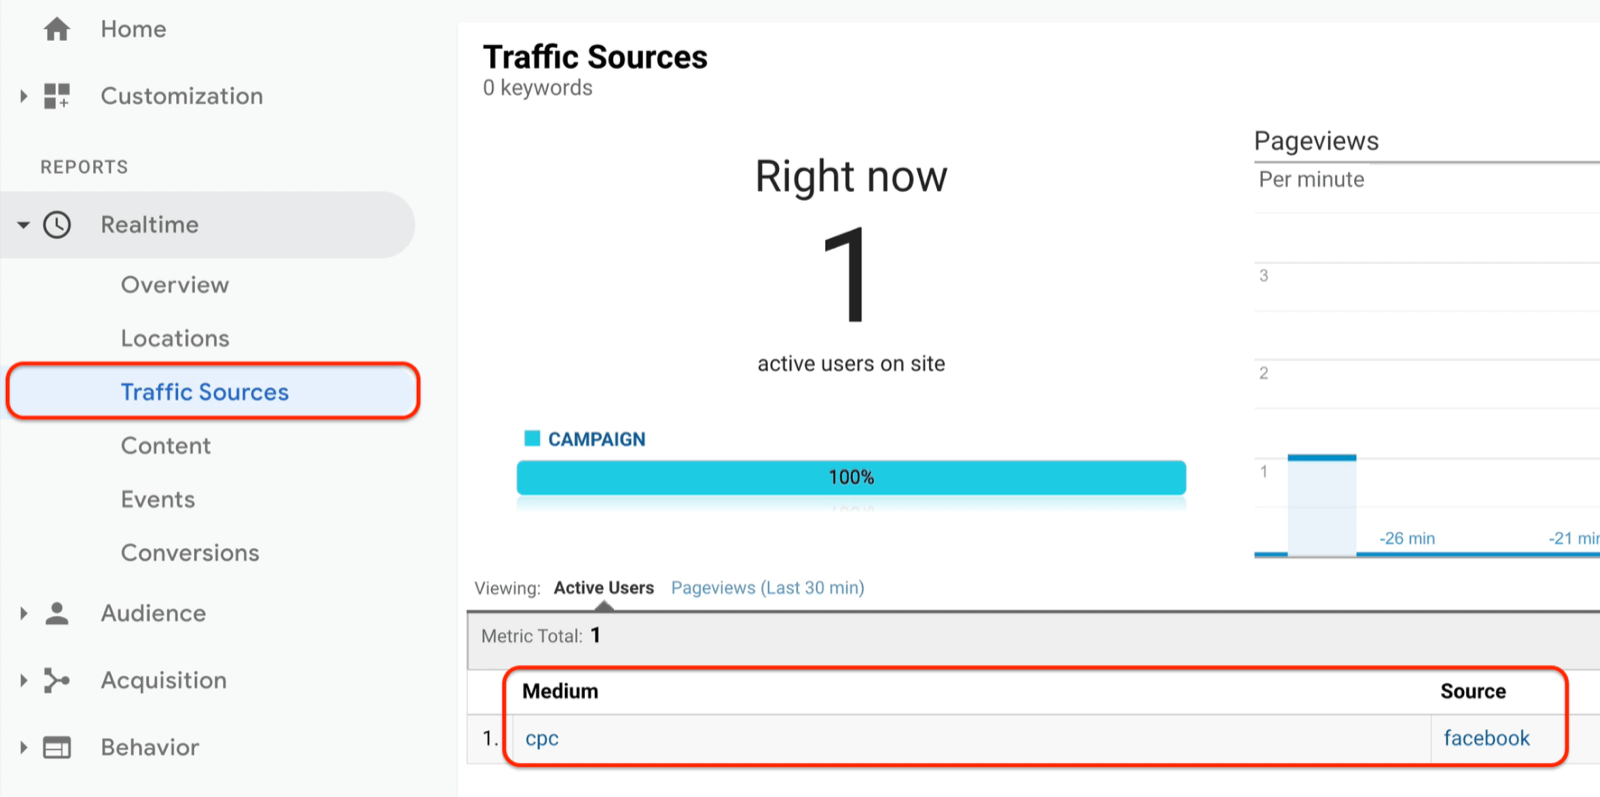
To check this, open Google Analytics and click Realtime > Traffic Sources in the left navigation.
Right away, we see “facebook / cpc” for the UTM we just created. This lets you know that the UTM is being seen and recorded in Google Analytics. Once you’ve confirmed that, you’re officially ready to put that link out into the world.
And that’s officially how to use UTMs with Google Analytics. You may be wondering, “Okay, I have hundreds and thousands of links. Do I really have to type them all into this form to get UTMs to work?” No, you don’t. That’s where the foundational framework we discussed earlier comes in.
Create UTMs Without the Google Campaign URL Builder
You don’t always have to use the URL Builder to create UTMs. While it’s a helpful tool if you’re just starting out, you could just as easily change UTMs and create them on your own. All you need to do is look in the address bar of the browser when you have this format set up and just change the parameters as needed.
To visualize this, let’s say we want to manually change the URL for the Facebook ad example. We’ll change the source to “infusionsoft” and the type of traffic to “email” but keep the campaign the same.
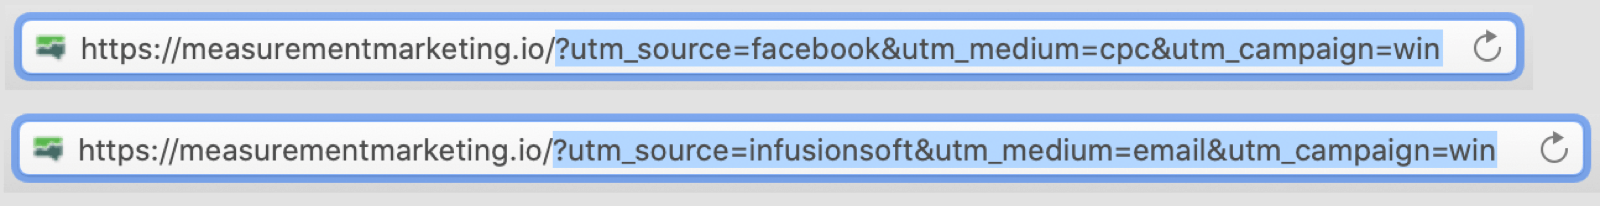
It’s important that the campaign is the same because having too many campaigns can make tracking difficult. Instead, you should coordinate them. That way, Google Analytics will start recording them in a way that makes it easy to figure out how the campaign is doing.
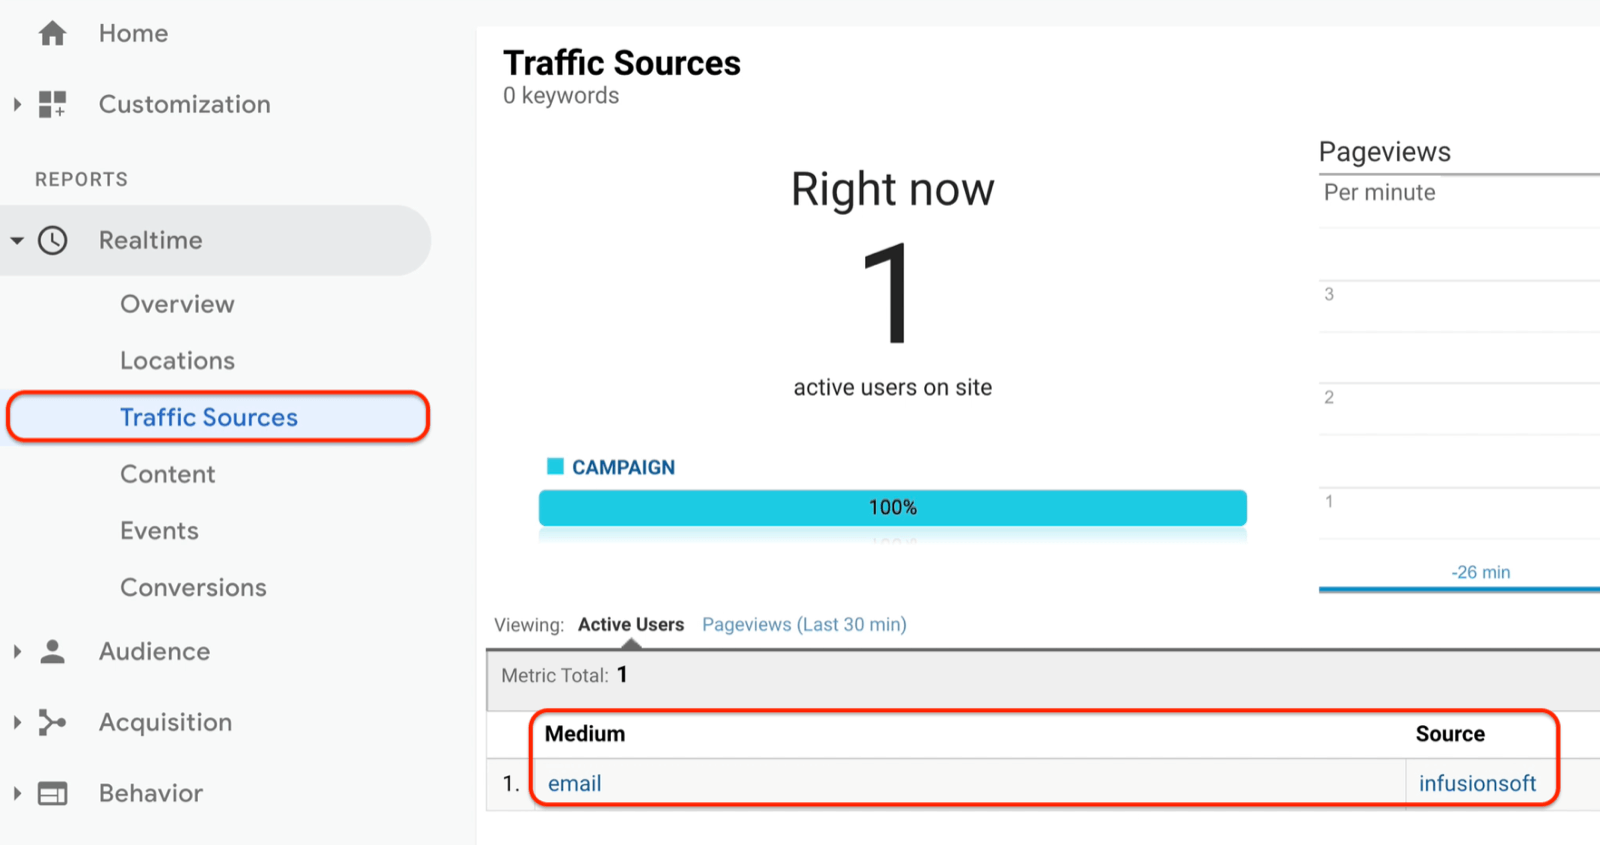
Once you’ve created your UTM, go into Google Analytics and make sure you see “infusionsoft” and “email” as the source/medium. If everything checks out, the link is ready to go out into the wild. In this case, I would hyperlink it to whatever email I’m sending out. Then anybody who clicks on that link will come to the home page and I’ll know that traffic came from our email system.
Conclusion
The biggest mistake I see most marketers make really comes down to how they’re asking questions. Don’t feel bad if you’ve done this because I certainly did. Most marketers ask questions like, “How are people using our home page or going through our blog?”
The idea is that if you magically knew this information, you would change things. You would take specific actions and get better results. But if you think about it, you don’t actually have an idea of what you would do with that information. It’s hard to tie it to action.
I’m going to give you a way out of that with something called “marketing forward.” Instead of always going into your data to say, “Hey, what just happened? How did the user just use our site?”, you think to yourself, “How are users supposed to use the site and did they use it like they were supposed to?”
It’s a subtle but powerful difference in how you use the reports. So if we go back to the home page example, instead of asking, “How are users using our home page?”, you ask, “Are users using our home page as it’s designed to be used?” Then you create a measurement for that.
So if users are supposed to interact with testimonials, you measure for that to see if they are. If they’re supposed to become leads because they’re clicking on opt-in forms, you measure for that to see if they are. You set up your dashboard to give you those answers right away.
Related Article
What’s a Good Landing Page Conversion Rate?
Business Agility Is the New Norm. Do You Have What It Takes?


Tags
#BBR Network, #LinkedIn #Social Media Marketing, #Profitability, #Small Business Growth, #Small Business Marketing and Sales, #SMB, #SME, B2B, Build Business Results, Build Business Results (BBR), Build Business Results (BBR) Mastermind.